
A good F1 points calculator does not try to guess the champion from one number. It answers a narrower question: how much runway does each driver still have, and how realistic is the market treating that runway? That distinction matters because championship odds often move before the standings make the change obvious.
GridOdds already tracks live championship prices on the drivers championship odds page. This article explains the calculator logic behind those numbers: remaining points, maximum possible score, elimination lines, and the gap between mathematical possibility and market probability.
Key takeaways
- The maximum-points line tells you who is still alive, not who is likely to win.
- A driver can have a strong points path and still be overpriced if their car pace is fading.
- A low market price can be rational when the points path needs multiple unlikely failures from rivals.
- Sprint weekends make the calculator more sensitive because extra points arrive before Sunday.
The Simple F1 Points Calculator Formula
The basic formula is straightforward: current points plus every point still available. For a normal Grand Prix, a driver can score 25 points for a win, plus one point for fastest lap if the current rules award it and the driver finishes in the required position. Sprint weekends add another points pocket before the race. Constructors math is the same idea, but it adds both cars.
The mistake is treating maximum points as a forecast. If a driver is 80 points behind but has 240 points still available, the calculator says the title is possible. It does not say the title is plausible. Probability comes from the quality of the path: how many wins are needed, how many rival failures are required, and whether the car has shown enough pace to make that path credible.

Maximum Points vs Market Probability
The market and the calculator answer different questions. The points calculator asks, can this driver still get there? Polymarket asks, what does the crowd think this path is worth right now? That is why the best use of a calculator is not replacing the odds. It is pressure-testing the odds.
Suppose Driver A trails by 42 points with 12 races left. The calculator says the gap is very recoverable. But if Driver A has qualified behind the leader for four straight weekends, their market price may stay low. The standings show opportunity; the odds price the performance trend. The edge appears when those two views disagree for a specific reason.
The Four Calculator Outputs That Matter
1. Remaining maximum points
This is the ceiling. It tells you whether a driver is alive and how much room there is for late-season volatility. Early in the season, almost everyone has a large maximum. Later, the ceiling becomes more useful because the gap between possible and impossible narrows quickly.
2. Required points swing per race
This is more useful than maximum points. If a driver needs to recover 90 points over 10 races, they need an average nine-point swing every weekend. That is not impossible, but it usually requires both superior pace and repeated losses for the leader. It is a better reality check than saying “there are 250 points left.”
3. Sprint sensitivity
Sprint weekends are leverage points. They add extra available points and create two market-moving sessions: sprint qualifying and the sprint itself. A title outsider with strong qualifying pace can look better on sprint-heavy calendars than a normal points table suggests.
4. Elimination threshold
The elimination threshold is the point at which a driver cannot win even if they score the maximum from every remaining race. This is useful for long-shot prices. If a driver is close to mathematical elimination and still has market volume, the price may be driven by fan interest rather than a realistic title path.

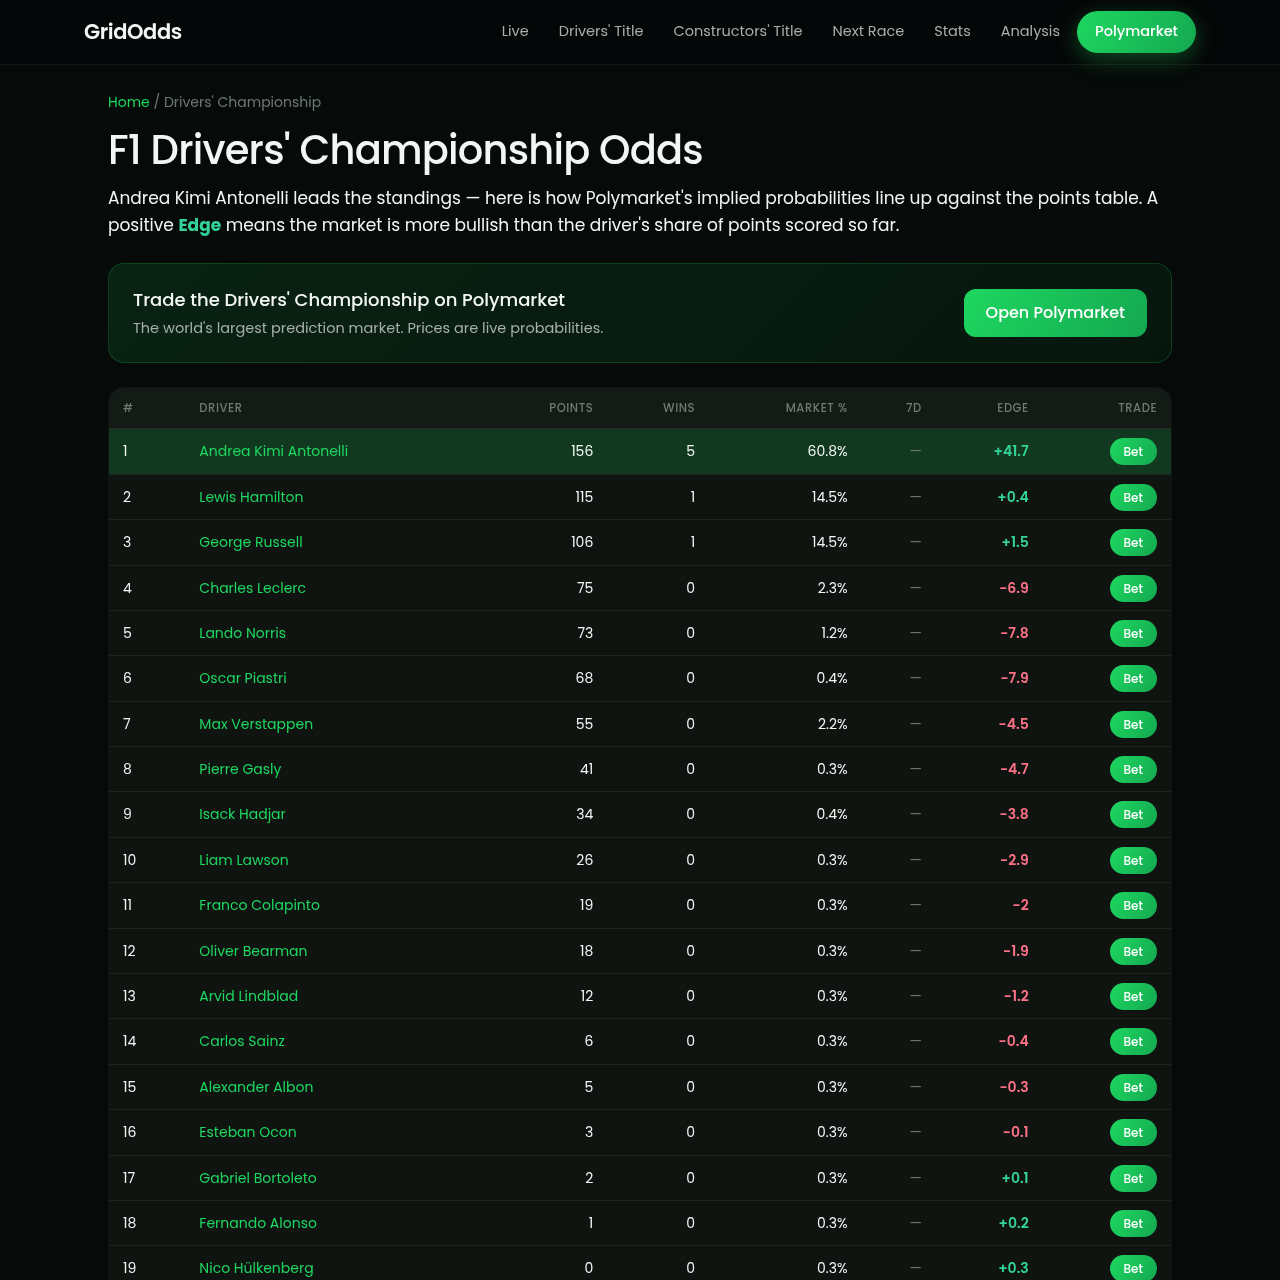
How to Read the GridOdds Drivers Page With Points Math
The GridOdds drivers table puts Polymarket probability next to the standings, points gap, and market-vs-table edge. That is the correct layout for this kind of analysis because it prevents one number from dominating the decision. A driver sitting second with a low market price may be cheap, but only if the gap and remaining points give them a believable path.
Where Points Calculators Mislead People
Points calculators become dangerous when they ignore context. A driver can mathematically win the title while needing a sequence of results that has almost no precedent. Another driver can look safe on points while their car has fallen behind on race pace. F1 is not a spreadsheet exercise; it is a development race with reliability, weather, strategy, and driver execution layered on top.
That is why the best GridOdds workflow is three steps: start with points runway, check the live market, then read the race-week context on the next-race page. If the calculator says a path exists and the market still gives it little value, the next question is not “is this a bet?” It is “what does the market know that the points table does not?”
A Practical Points Calculator Checklist
- Current points: where the driver starts today.
- Gap to leader: how much must be recovered.
- Remaining races: how many normal scoring chances are left.
- Sprint weekends: how many extra points pockets are available.
- Average swing needed: the points recovery required per weekend.
- Market probability: what Polymarket assigns to that path.
- Recent form: whether pace supports the math.
If you want the short version: points math tells you who can still win, while market probability tells you who traders think will win. The edge is in the gap between the two, especially before the public fully prices a form change, reliability pattern, or weather-heavy weekend.
GridOdds is an odds research site, not a sportsbook or financial adviser. Use this as educational analysis only, and only participate in prediction markets or betting products where it is legal for you.
How to Turn Calculator Output Into a Content Edge
The reason this topic deserves its own article is that most points calculators stop at arithmetic. They tell readers what can happen, then leave the hard question unanswered: what should the market do with that information? GridOdds can own the gap between those two jobs. A standalone calculator page can show the numbers, while this article explains how to interpret them without pretending that every mathematical path is a realistic forecast.
For example, a driver who needs to average a six-point swing per weekend may still have a credible title route if their team has recently unlocked pace. A driver who needs the same swing while qualifying behind their teammate every week probably has a weaker route. The points are identical; the probability is not. This is where the article should link readers back into the live site instead of trapping them in a static guide.
Driver Points vs Constructor Points
Driver and constructor calculators look similar, but the interpretation changes. A driver title path depends on one person beating rivals consistently. A constructor path depends on two cars scoring together. That makes team calculators more sensitive to weak second-car performance, reliability splits, and upgrade distribution. A team can have the fastest car and still lose ground if only one driver converts the pace into points.
That is why a constructors calculator should not just double a driver calculator. It should include contribution split, non-scoring weekends, and whether the team is relying on one driver to carry the total. The existing constructors championship page gives the market layer; a future calculator can add the scenario layer.
What a Strong F1 Points Calculator Should Include
- A live standings baseline so the article never becomes stale after one race.
- Remaining race and sprint counts, separated instead of merged into one vague total.
- Maximum possible points for each driver and team.
- Average points swing needed per weekend.
- A market probability column from Polymarket or another transparent price source.
- A warning when a mathematically possible path needs an unrealistic run of results.
- Internal links from each driver or team row into the relevant GridOdds profile page.
That final point is important for SEO. A calculator should not be a dead-end tool. It should distribute internal authority into driver pages, constructors pages, odds-history pages, and race-week analysis. If a reader lands on this article from Google, the next useful click should be obvious.
How This Avoids Cannibalizing Existing Odds Pages
This article should not try to rank for the same query as the main drivers odds page. The drivers page owns the live market table. This page owns the calculator intent: “how many points can still be scored?” and “what does the remaining path look like?” That separation keeps the site clean. The calculator article explains the method, then links to the live page for the current data.
The same logic applies to prediction articles. Who will win the F1 championship answers the broad fan question. This article answers the analyst question. The overlap is intentional, but the search intent is different enough that each page can support the other rather than competing.
Bottom Line
An F1 points calculator is valuable when it helps readers separate mathematical survival from realistic title probability. The market is not always right, but it usually prices more than the standings table. The useful edge comes from comparing both: the remaining points path, the expected points swing, and the live probability traders are assigning today.
Search Intent: What Readers Actually Want From This Page
The search intent behind “F1 points calculator” is not purely informational. Readers want a tool, but they also want interpretation. The current SERP is dominated by utility pages, simulators, and a Reddit thread. That tells us the winning GridOdds page should not read like a generic blog post. It should feel like a calculator explanation that happens to have live market context.
That is why the article should lead into a calculator module once the Value Lab is live. The body can explain the logic, while the tool can let readers change assumptions. That combination is stronger than a static points table because it gives Google useful text and gives readers a reason to interact.
Example Scenario: The Misleading Long Shot
Imagine a driver is 95 points behind with 14 races and three sprint weekends left. The raw maximum points say the title is still alive. A weak article would stop there and call the driver a sleeper. A better calculator asks for the required swing per weekend. If the driver needs to outscore the leader by nearly seven points every race weekend, the title path requires repeated podium gaps or multiple DNFs from the leader.
If the market gives that driver 2%, the price may be rational. If the market gives them 8%, the price may be driven by brand, fan interest, or stale belief from earlier in the season. The calculator turns that debate into numbers.
Example Scenario: The Quiet Value Contender
Now imagine a driver is only 38 points behind, has outqualified the leader three weekends in a row, and has several strong circuits coming up. The points calculator says the gap is manageable. The market may still be slow to react if the standings leader has a larger fan base or if the contender's recent pace has not yet become the public narrative. This is the kind of situation where GridOdds can provide original value: not by giving a pick, but by making the gap between points path and market belief visible.
Internal Linking Plan for This Cluster
This article should become the method page for all future points-calculator content. The homepage and drivers odds page can link here when discussing remaining-points math. This page should link back to live odds, standings, constructors odds, and expected value. Race-specific previews can link here whenever a points swing is central to the weekend story.
That structure avoids cannibalization. Each page has a job: the live page updates, the standings pages compare market and table, this calculator page explains the math, and the expected-value page explains how to price the disagreement.
Frequently Asked Questions
- What is an F1 points calculator?
It is a tool or method for estimating maximum possible points, required points swings, and title paths from the current standings.
- Why does Polymarket price differ from points math?
Polymarket prices future probability, not current standings. Traders price pace, reliability, remaining calendar, and market information.
- Are F1 points calculators useful for betting?
They are useful for analysis, but they are not a betting system. Treat them as context for understanding odds, not as picks.