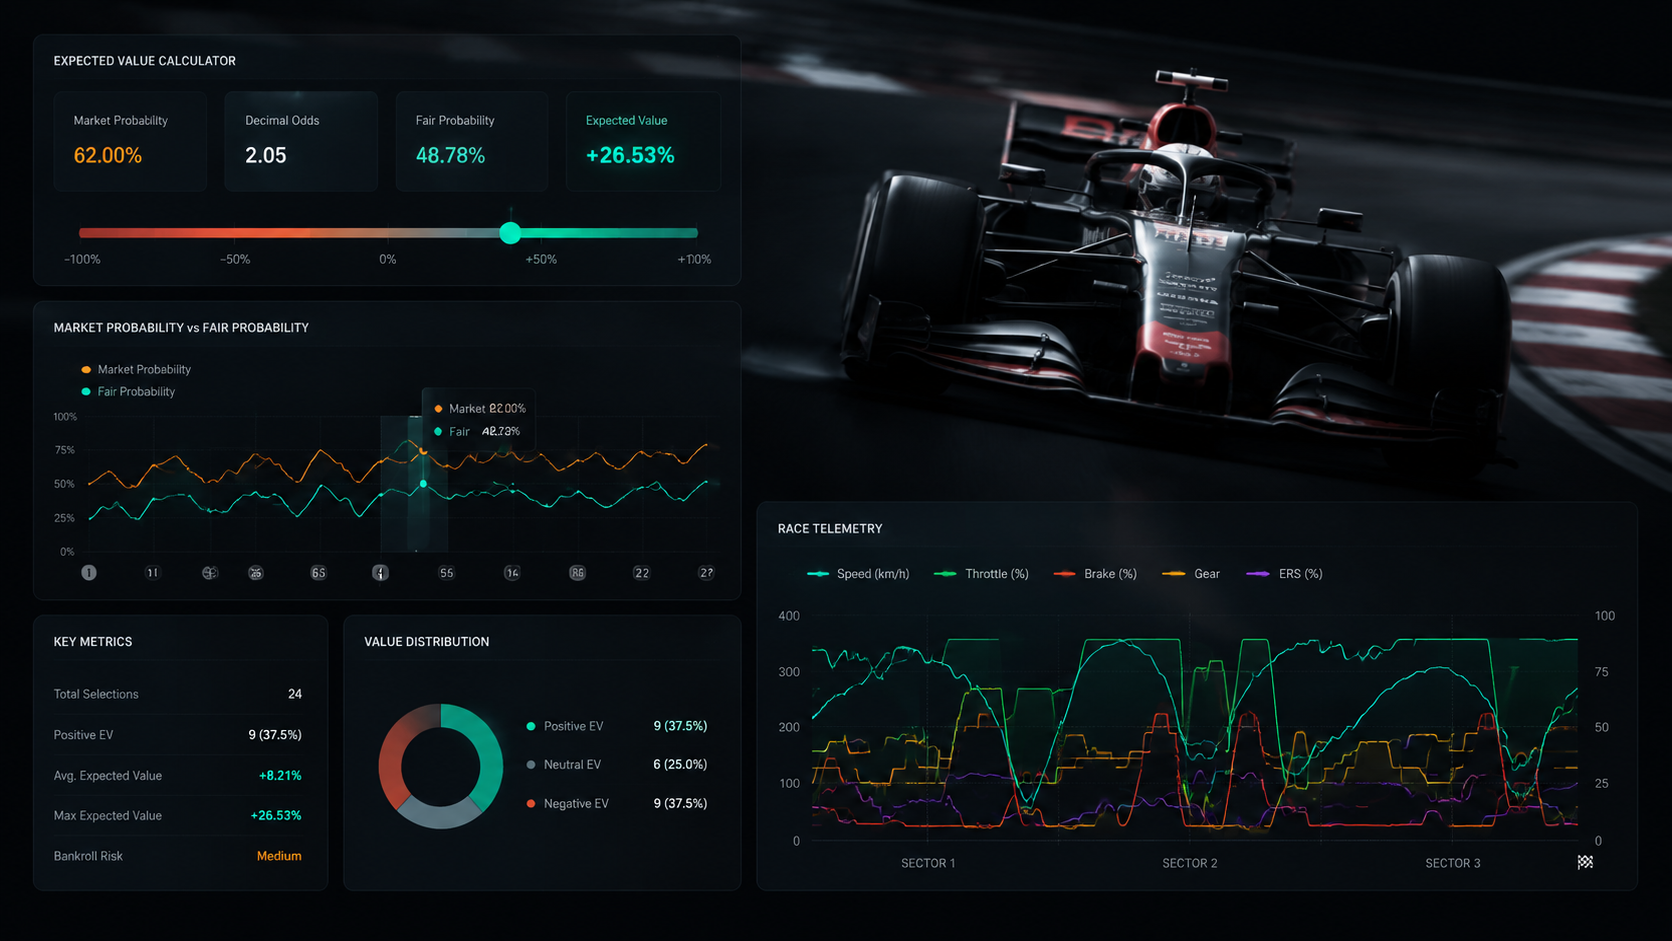
F1 expected value betting starts with a simple comparison: what does the market imply, and what do you think the true probability is? If those two numbers differ, there may be value. If they differ because your estimate is weak, there may just be overconfidence.
This matters for prediction markets because Polymarket prices are already probabilities. A Yes share at $0.28 implies roughly 28%. If your fair probability is 35%, the contract may be underpriced. If your fair probability is 20%, the same contract is expensive. The hard part is not the formula. The hard part is estimating probability responsibly.
Key takeaways
- Expected value is market price versus your fair probability.
- On Polymarket, Yes price is already implied probability.
- Positive EV is not a guarantee; it depends on your estimate being better than the market.
- Kelly sizing should be treated as a ceiling, not a command.
The F1 Expected Value Formula
For a Polymarket Yes share, the clean formula is: fair probability multiplied by $1.00 payout, minus the market price. If the contract costs $0.28 and your fair probability is 35%, the EV is $0.35 minus $0.28, or $0.07 per share. That is positive expected value if your 35% estimate is accurate.
For a No share, flip the probability. If your fair probability of the driver winning is 35%, your fair probability of No is 65%. Compare that against the No price. The logic is the same.

Breakeven Probability
Breakeven probability is the probability required for a position to be fair at the current price. On Polymarket, a Yes price of $0.28 has a breakeven probability of 28%. A price of $0.62 has a breakeven probability of 62%. If your fair probability is higher than breakeven, the position is positive EV. If it is lower, it is negative EV.
Traditional sportsbook odds require conversion from decimal, fractional, or American odds. Prediction markets remove that conversion layer. That is one reason they are useful for analysis even if you never trade.
Why F1 Probability Is Hard
F1 is not a coin flip. A driver championship probability includes car pace, development rate, reliability, teammate dynamics, team strategy, penalties, remaining circuit mix, sprint weekends, and weather exposure. A model can be useful, but it can also become falsely precise.
A fair probability should not come from one opinion. A better estimate uses multiple inputs: current points, required points swing, recent qualifying pace, long-run pace, reliability trend, and market movement. The F1 points calculator guide explains the math layer; this article explains how to turn that into a value comparison.
Conservative Kelly Sizing
Kelly criterion estimates how much of a bankroll to stake when you believe you have an edge. In theory, it maximizes long-term growth. In practice, full Kelly is too aggressive for subjective markets like F1 because your probability estimate can be wrong. A small error in probability can produce a large sizing mistake.
If you use Kelly at all, treat it as a ceiling and cut it heavily. Half Kelly, quarter Kelly, or a fixed small position size is more realistic for most people. The calculator should show the math, then remind readers that uncertainty is not captured by the formula.

A Practical Value Workflow
- Start with the market price and convert it to implied probability.
- Build a fair probability range, not one exact number.
- Use points math and remaining calendar to test whether the range is plausible.
- Check odds history to avoid chasing a stale move.
- Check news, weather, and qualifying context before acting.
- Only call something value if your edge survives a conservative probability haircut.
What Positive EV Does Not Mean
Positive EV does not mean the outcome is likely. A 12% outcome can be positive value at a 7% price and still lose 88 times out of 100. Positive EV also does not mean your estimate is correct. The market may be pricing information you missed, especially around reliability, penalties, or team development.
The goal of GridOdds value content is not to hand out picks. It is to make the probability disagreement visible and testable. If a reader cannot explain why their fair probability differs from the market, the edge probably is not real enough to trust.
GridOdds is an odds research site, not a sportsbook or financial adviser. Use this as educational analysis only, and only participate in prediction markets or betting products where it is legal for you.
Building a Fair Probability Range
The safest way to use expected value is to build a probability range rather than one exact estimate. If you think a driver has a 35% chance, ask what your low and high estimates are. Maybe the conservative view is 30% and the optimistic view is 40%. If the market price is 28%, the position may still look interesting after a haircut. If the market price is 34%, the supposed edge disappears once you admit uncertainty.
This is especially important in F1 because a single mechanical failure, penalty, or safety car can change the result without proving the original probability estimate was bad. The range keeps you honest. It also stops the calculator from turning into a false-precision machine.
Inputs That Can Support a Fair Estimate
- Current points and maximum remaining points.
- Recent qualifying pace versus teammate and title rivals.
- Long-run pace from comparable circuits.
- Reliability trend and component usage.
- Upcoming calendar fit for the car's strengths.
- Weather exposure across the next few races.
- Market movement history, especially after major sessions.
None of these inputs is enough alone. Points without pace can mislead. Pace without reliability can mislead. A strong calendar fit can be undone by penalties. Expected value improves when the estimate is built from several independent signals rather than one argument you already wanted to believe.
Example: When a Price Looks Cheap
Imagine a driver trading at 18%. Your model range says 22% to 28%. On paper, that is positive expected value. The next step is not rushing to the CTA. The next step is trying to kill the idea. Did the market move down because of reliability news? Is there a grid penalty pending? Did the driver look fast only because of low fuel? Is the calendar about to shift toward circuits that suit a rival?
If the edge survives those questions, then the calculator has done its job. It has turned a vague opinion into a testable probability disagreement. If the edge collapses, the calculator still helped because it stopped a weak trade before it became real money.
Example: When a Price Looks Expensive
The same logic works in reverse. A title favourite at 64% may look dominant, but if your fair range is 50% to 58%, the market may be too confident. That does not mean the favourite is bad. It means the price may not compensate for the remaining uncertainty. In a prediction market, that can make the No side more interesting than the Yes side.
For readers, this is a useful distinction. Expected value is not about cheering for outsiders. It is about comparing price with probability. Sometimes the favourite is value. Sometimes the long shot is still too expensive. Sometimes the best decision is no position.
How the Future GridOdds Value Lab Should Use This
The Value Lab should make this workflow visible. A reader should be able to select a driver, see the current market price, enter a fair probability range, and immediately see breakeven, expected value, and conservative sizing. The result panel should explain the trade-off in plain English: “Your low estimate is below market, so this edge depends on an optimistic view,” or “Even after a haircut, your fair range is above market.”
That kind of calculator is useful because it teaches discipline. It also creates natural internal links. A driver result can link to the driver page, the points calculator, odds history, and the weekend context. That is better for users and better for topical authority than a standalone affiliate box.
Responsible Use
Expected value is an analytical concept, not a promise. It can make bad decisions look professional if the input estimate is careless. Never use an EV calculator to justify chasing losses, oversizing positions, or trading in markets you do not understand. The responsible interpretation is simple: if the edge is not obvious after conservative assumptions, it probably is not strong enough to matter.
Bottom Line
F1 expected value starts with price versus probability, but the real skill is humility. The market can be wrong, and so can you. A useful calculator makes that uncertainty visible. It shows the breakeven point, tests your fair range, and forces the question that matters most: does the edge survive when you make your assumptions more conservative?
Search Intent: Education Before Picks
Expected value queries can attract readers who want picks, but that is not the angle GridOdds should take. The safer and stronger SEO angle is education: how to compare your own probability with the market, how to avoid false precision, and how to use calculators responsibly. That aligns with Google's helpful-content direction because the page teaches a process instead of promising outcomes.
This also protects the site from becoming a thin affiliate page. Affiliate CTAs can exist, but they should come after original analysis. The core value is the calculator framework, the examples, and the explanation of why market disagreement is not automatically an edge.
Example Scenario: Fair Probability Range
Assume the market price is 24%. Your first estimate is 31%. That looks like a seven-point edge. But a fair range forces you to stress-test the estimate. If your conservative estimate is 23%, your base estimate is 31%, and your optimistic estimate is 36%, the edge depends heavily on the middle and high cases. That is weaker than an edge where even the conservative estimate is above market.
A good Value Lab calculator should show that visually. It should not just output “positive EV.” It should say whether the market price sits below the whole range, inside the range, or above the range. That is a much more honest reader experience.
Example Scenario: Negative EV on a Likely Winner
Many readers confuse likely with valuable. A driver can have a 60% chance to win the championship and still be a bad price at 72%. In that case the favourite is likely, but the market is too expensive. Conversely, a driver with a 12% chance can be good value at 7%. Expected value separates probability from price.
This is especially useful for F1 because the public often overweights driver reputation. Big names can trade rich, while less popular drivers with strong car pace can lag behind. That does not mean every unfashionable driver is value. It means the market should be checked against a disciplined probability range.
How This Article Should Support the Value Lab
When the Value Lab page launches, this article should become one of its main educational links. The calculator can do the math, but this article explains how to choose inputs. That is an important distinction. A tool without explanation can create false confidence; an article without a tool can feel theoretical. Together, they create a defensible content asset.
Internally, this page should link to the points calculator, live odds, odds history, and Polymarket explainer. Those links help readers build a complete workflow: understand the market, calculate the points path, compare fair probability, then decide whether the disagreement is meaningful enough to keep watching.
Frequently Asked Questions
- How do I calculate expected value for F1 odds?
Convert the market price to implied probability, estimate your fair probability, then compare the two. On Polymarket, the Yes price is already the implied probability.
- Can expected value help with F1 championship markets?
Yes, especially when used with points math, odds history, and race-week context. It should not be used alone.
- Is Kelly criterion safe for F1 betting?
Full Kelly is usually too aggressive for subjective sports markets. Fractional Kelly or fixed small sizing is safer.